Just a few weeks ago, we launched the Company results view. Today, we’re completing the analysis experience with the missing piece: question-level detail.
We’ve added a new layer of depth so you can understand the why behind every result, without leaving the view.
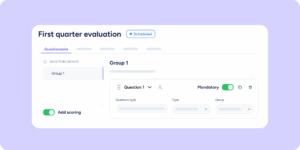
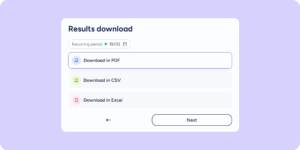
From now on, when you click on any question within the group cards, a side panel will open showing all the detailed information.
Everything you can analyze in the question detail
- Response distribution
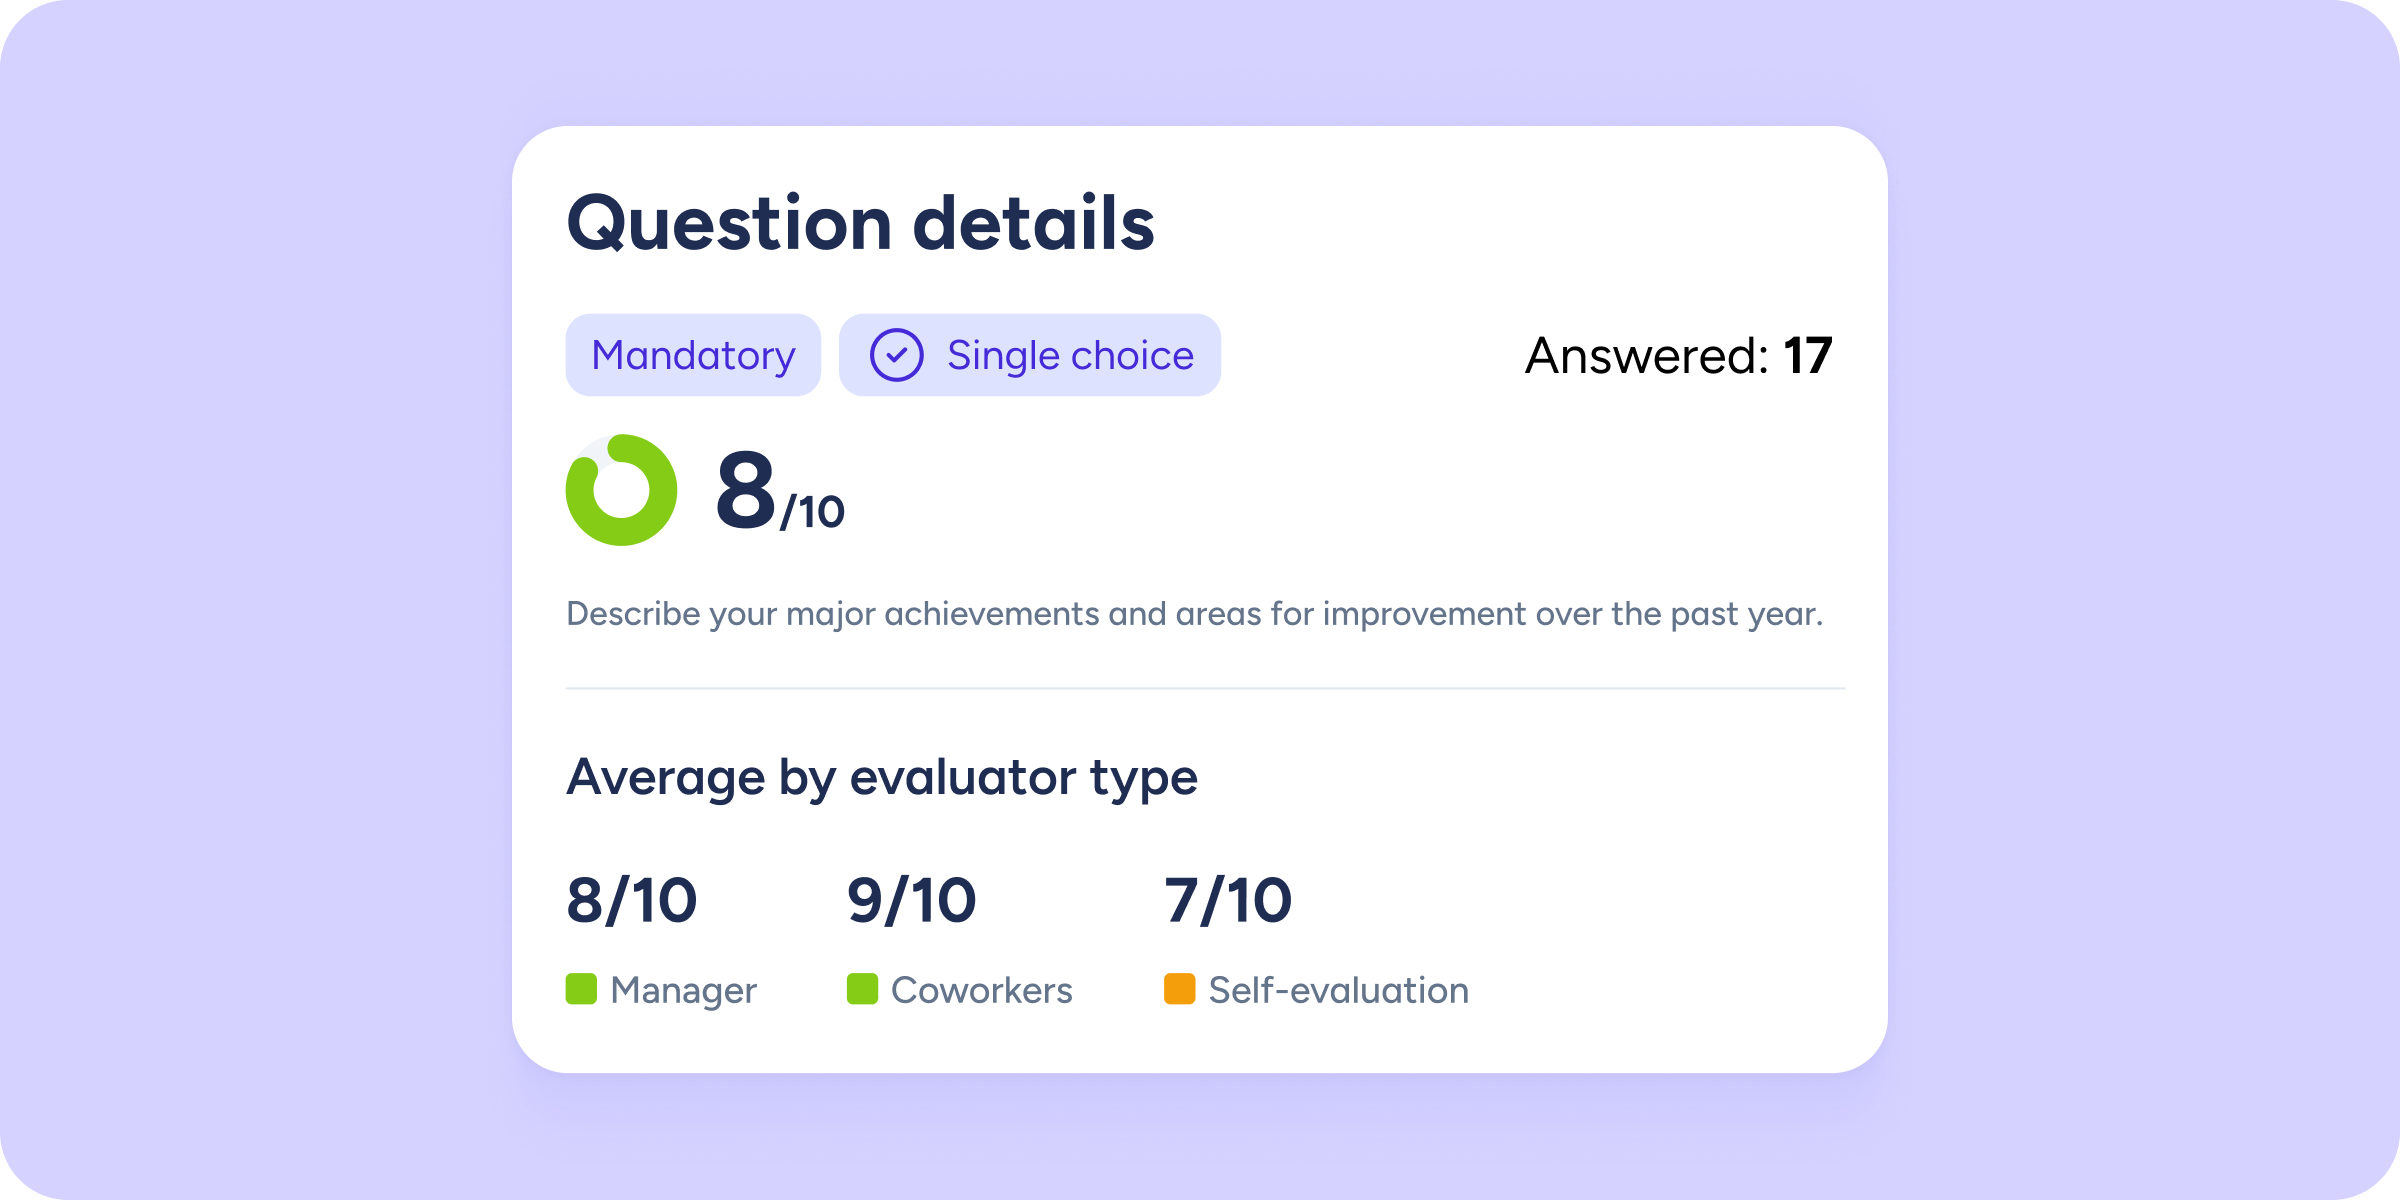
Don’t stop at the average. See a visual breakdown of how responses are distributed and how many people skipped the question, so you can identify consensus or polarization in opinions. - Breakdown by evaluator type
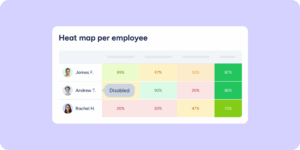
How did managers score compared to peers? Compare average scores by evaluator type to spot perception gaps. - Ranking of evaluated employees
Access the full list of people evaluated for that specific question. By default, results are ordered from highest to lowest score, so you can quickly identify top performers or areas for improvement.
Need more detail? Expand any employee’s profile to see exactly which score they received from each role.
Smooth and powerful analysis
To keep your experience fast and seamless, we’ve integrated this detail view with the rest of the tools:
- Persistent filters
Any filters applied in the main view, such as workplace, department, or group, will automatically carry over to the question detail. - Adaptability
This view works for all types of evaluations. If your question is text-based, organizational-chart-related, or has no score, you’ll automatically see written responses or selection percentages instead.