We’re adding a new visual block in the Company results section so you can compare performance across different areas of your organization at a glance. It’s no longer just about knowing “how the company is doing,” but understanding “who’s doing better and who needs support.”
A visual snapshot of your organization
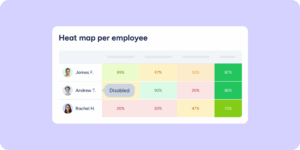
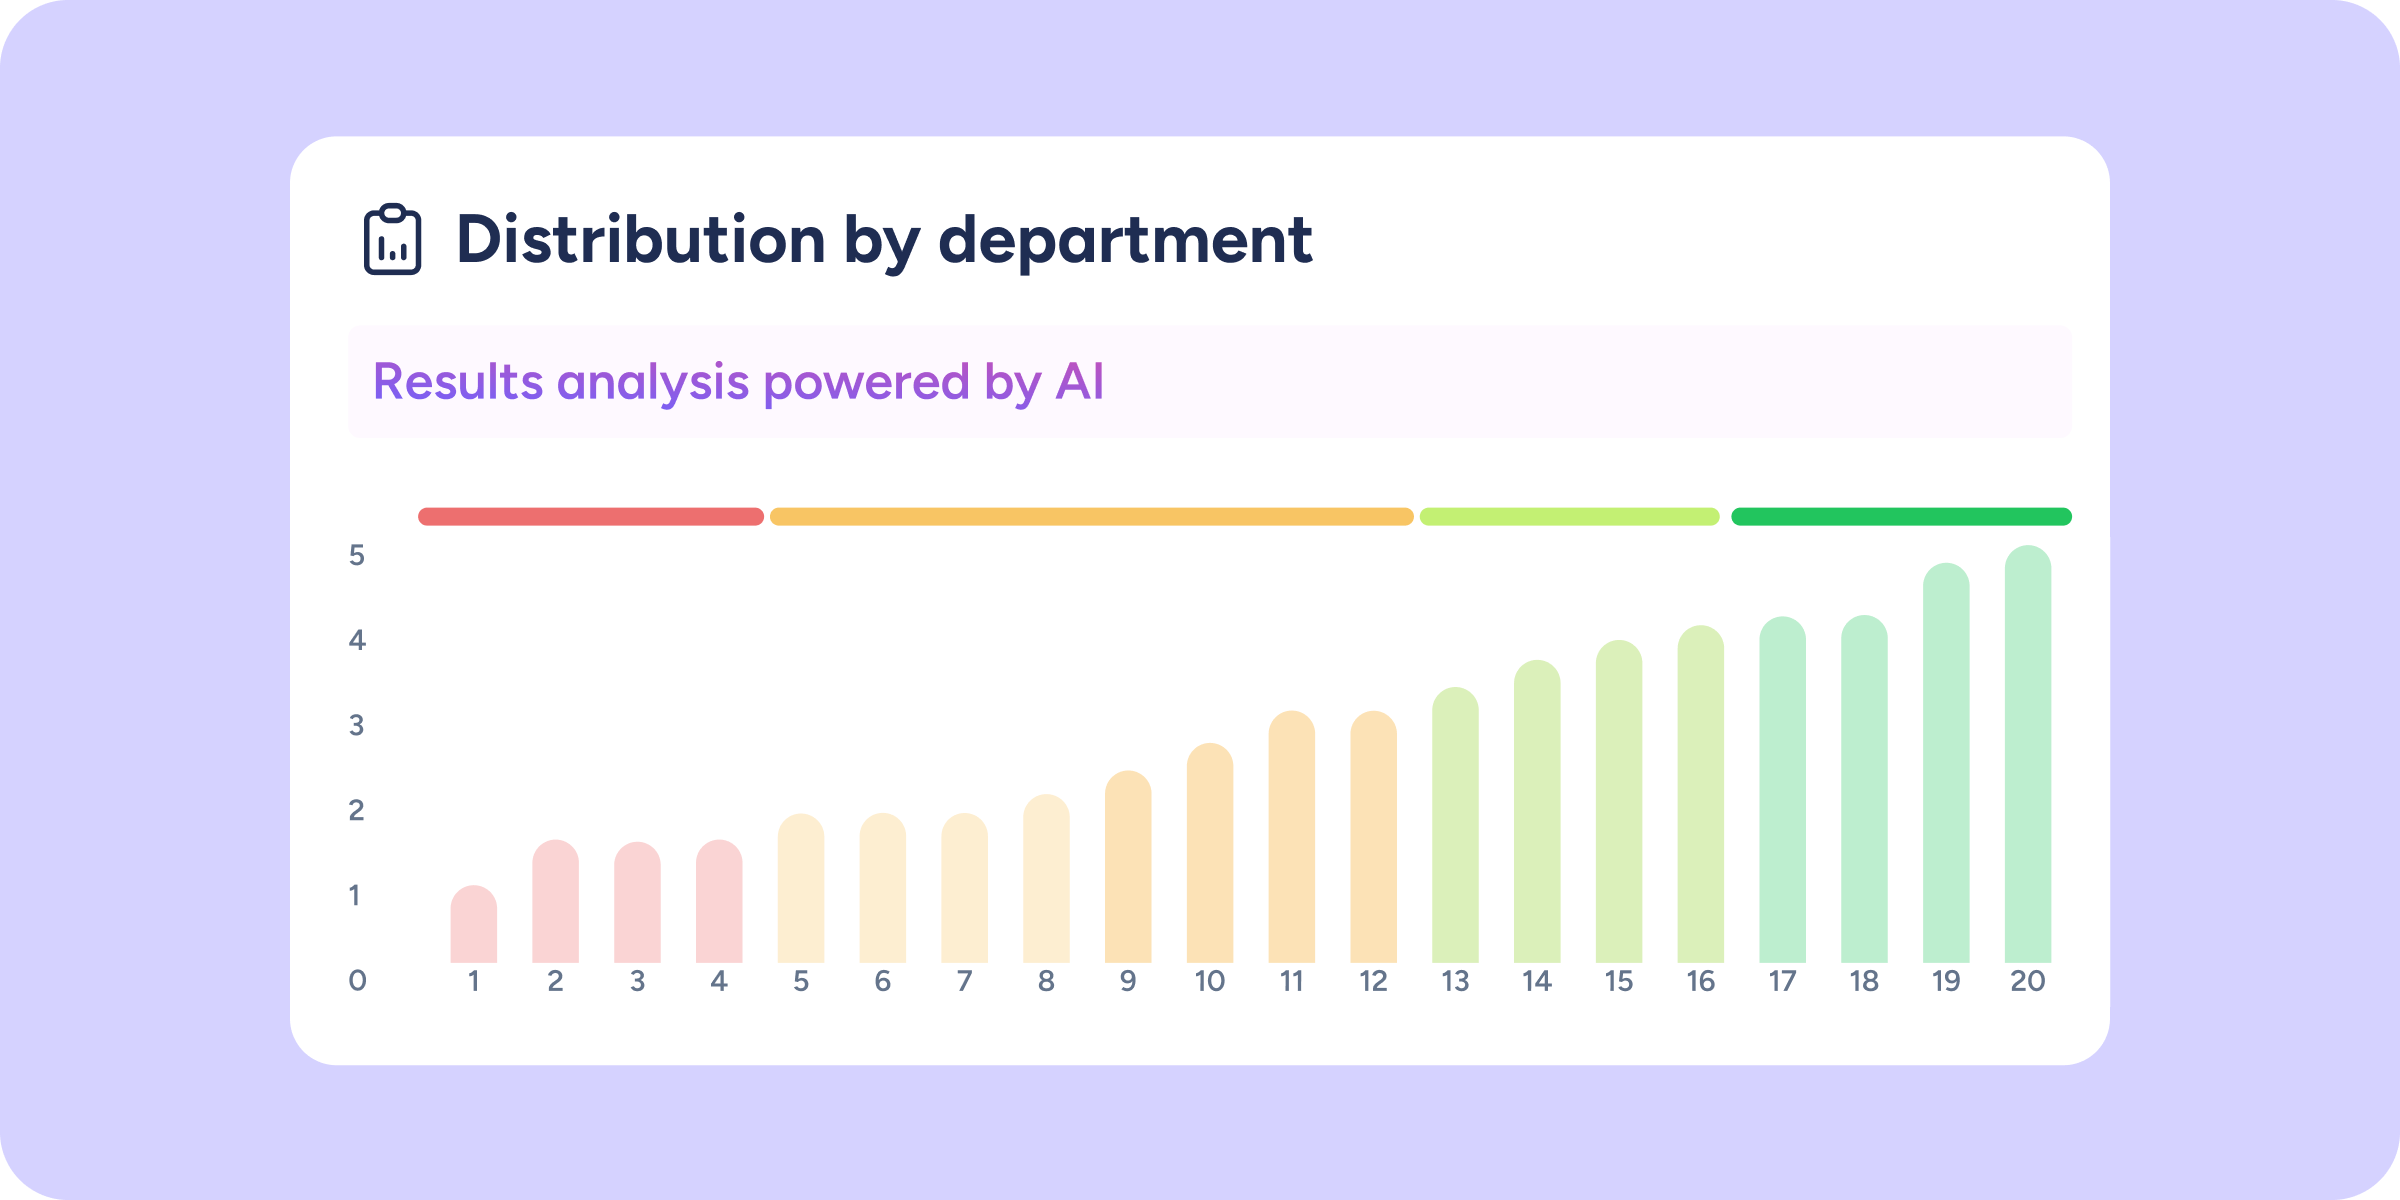
Discover behavior patterns instantly thanks to this bar chart design:
- Priority ranking (lowest to highest): bars are sorted by default from lowest to highest score, allowing you to identify which department, workplace, or organizational group requires priority intervention.
- Color grouping: teams are visually grouped by colors according to their score range (from red to green), creating an instant heat map of your company’s overall status.
- Total versatility: change the selector to view distribution by department, workplace, or organizational group, and the ranking will update automatically.
Interactivity and precision
This new chart integrates seamlessly with your usual workflow:
- Global filters: the chart respects your current view configuration. If you apply filters, the distribution bars will automatically recalculate to reflect your exact selection.
- Data focus: hover over the color legend to highlight all teams within that range at once. If you prefer to see the details of a single department, hover over its bar or name to isolate that specific result.