Your performance indicators speak the language of business

Some decisions can’t be made by looking at shifts alone. How much does your team produce for every planned hour? How much will it cost the business to include certain people in the schedule? What percentage of revenue goes to salaries? How far off is the actual cost from the estimate?
Until now, the Shifts performance indicators answered some of these questions. From today, they answer all of them: we’ve gone from 4 basic indicators to a full dashboard of 15 metrics that connect your planning with real business performance.
What indicators are available now?
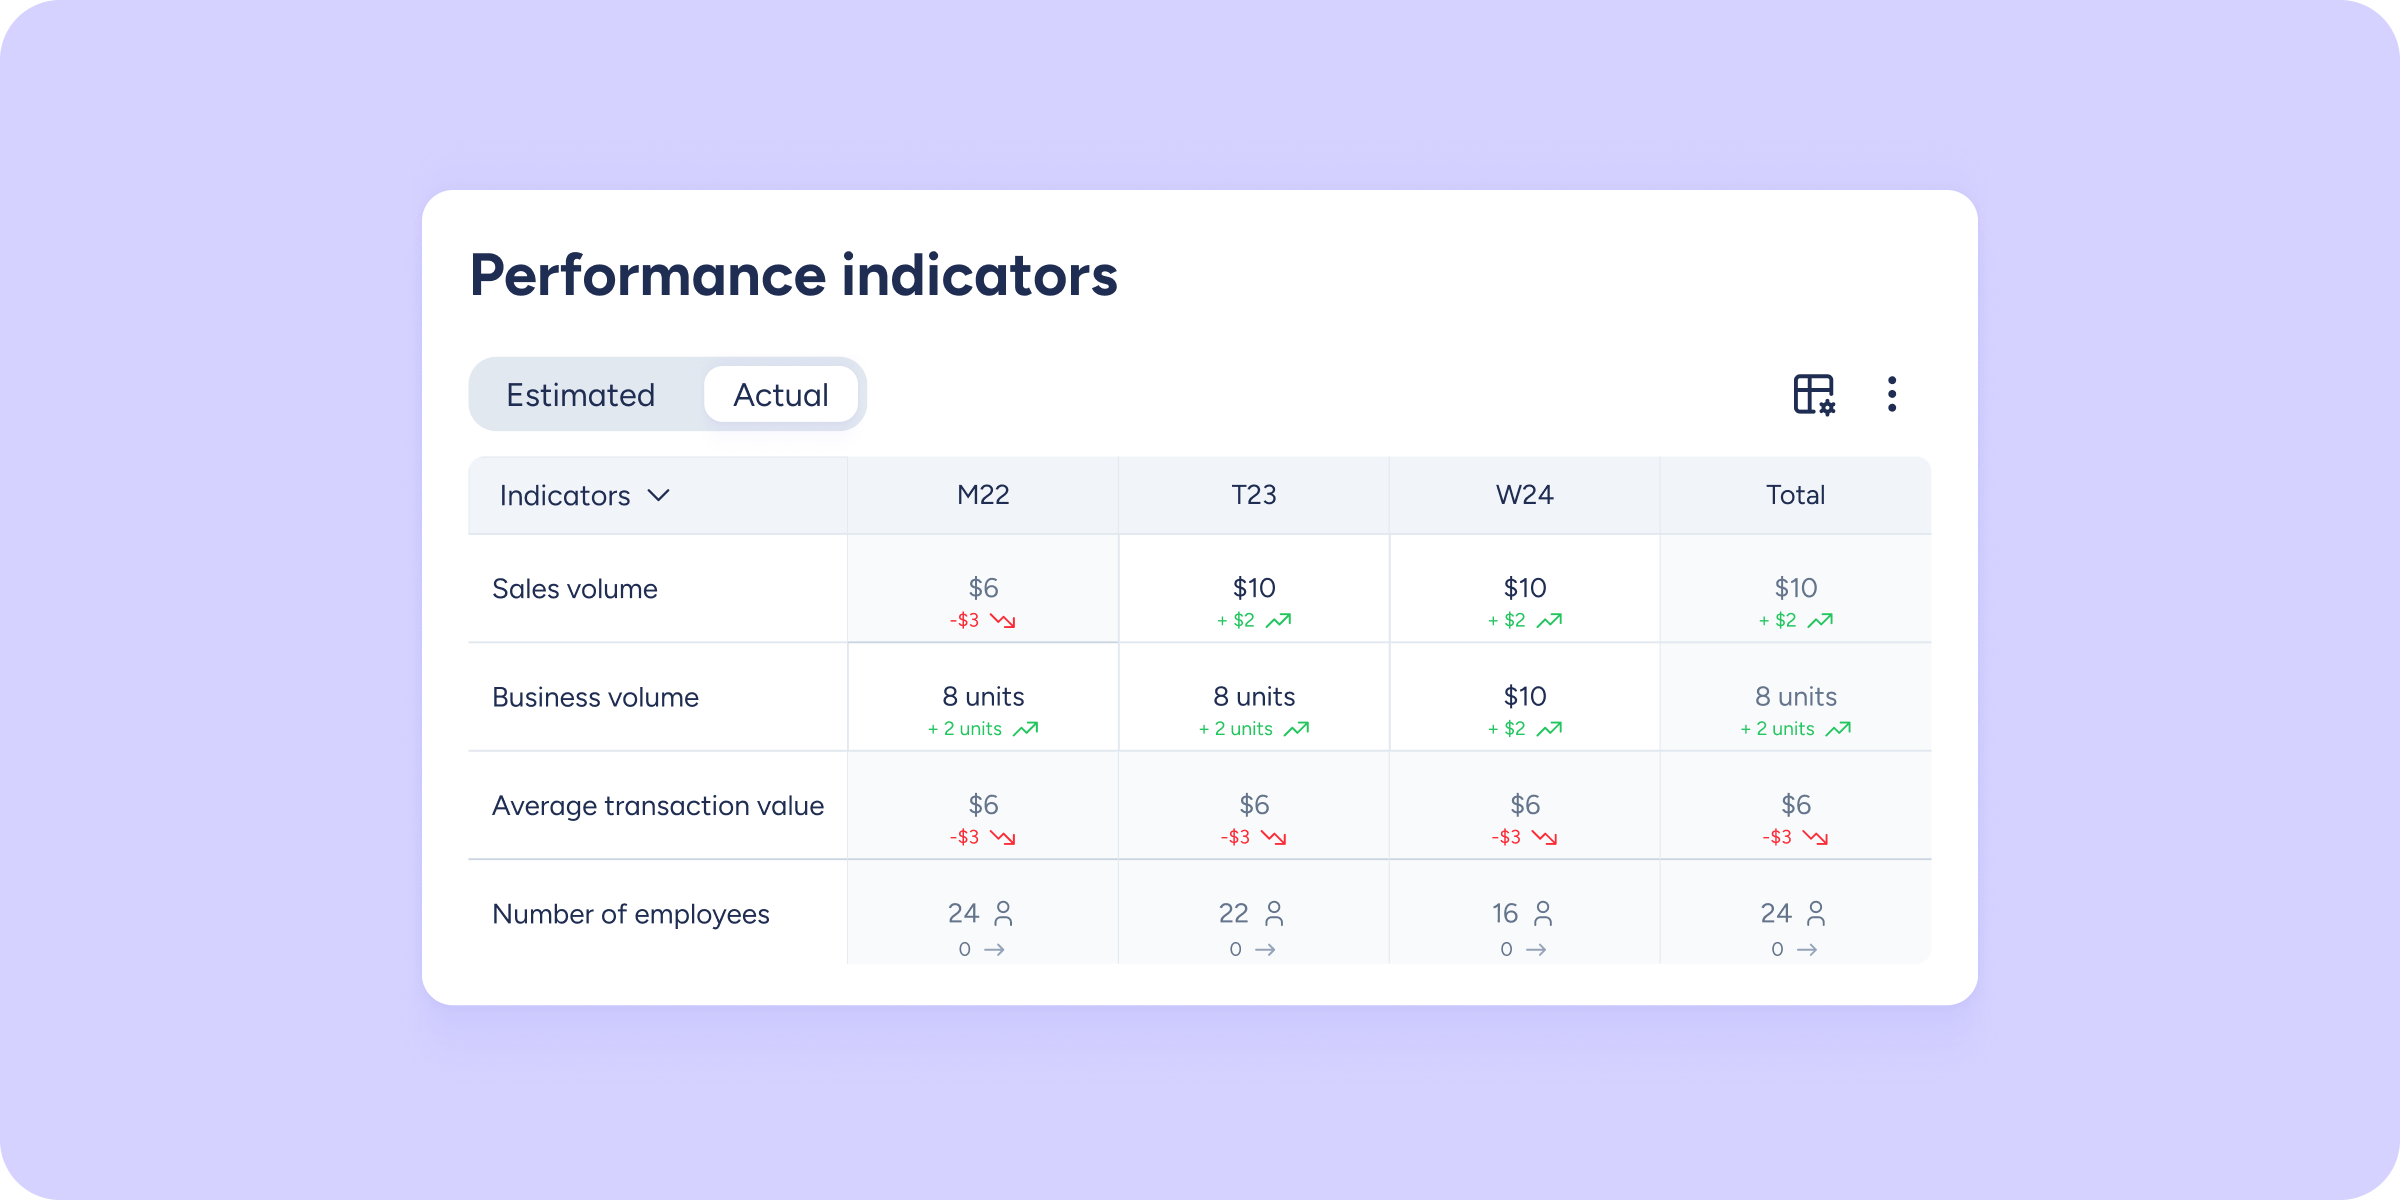
In addition to the indicators you already knew (business volume, employee cost, cost/sales, and sales/cost), you’ll now also find: sales volume, average transaction value, number of employees, planned hours, productivity per hour, product volume, percentage of revenue allocated to salaries, and payroll: average gross cost per employee (per hour) and gross cost of the entire workforce (per hour).
Estimated and actual, always side by side
All indicators are available across both tabs in the table: the planning tab (Estimated) and the actual performance tab (Actual). This lets you compare at any time whether the plan is being met or whether there are variances.
Additionally, when data is available in both tabs, the “Actual” tab will show the difference from the estimated figures.
Remember! For the performance indicators to display correctly, you need to assign a gross salary to employees from Employee profile >> Contracts >> Salary.
What does this mean for you?
💰 Planned vs. actual cost, no manual work: compare in real time what you estimated against what actually happened, broken down by day and by week.
📊 Indicator visibility: enable or disable key metrics (hours, business volume, cost per employee, etc.) with a toggle. See only what you need.
📥 Export in one click: download the table in PDF, Excel, or CSV for your internal reports or management presentations. No formatting, no extra work.
⚡ Reuse your planning: copy the cost estimate from the current week to the next and save time on what’s already working.
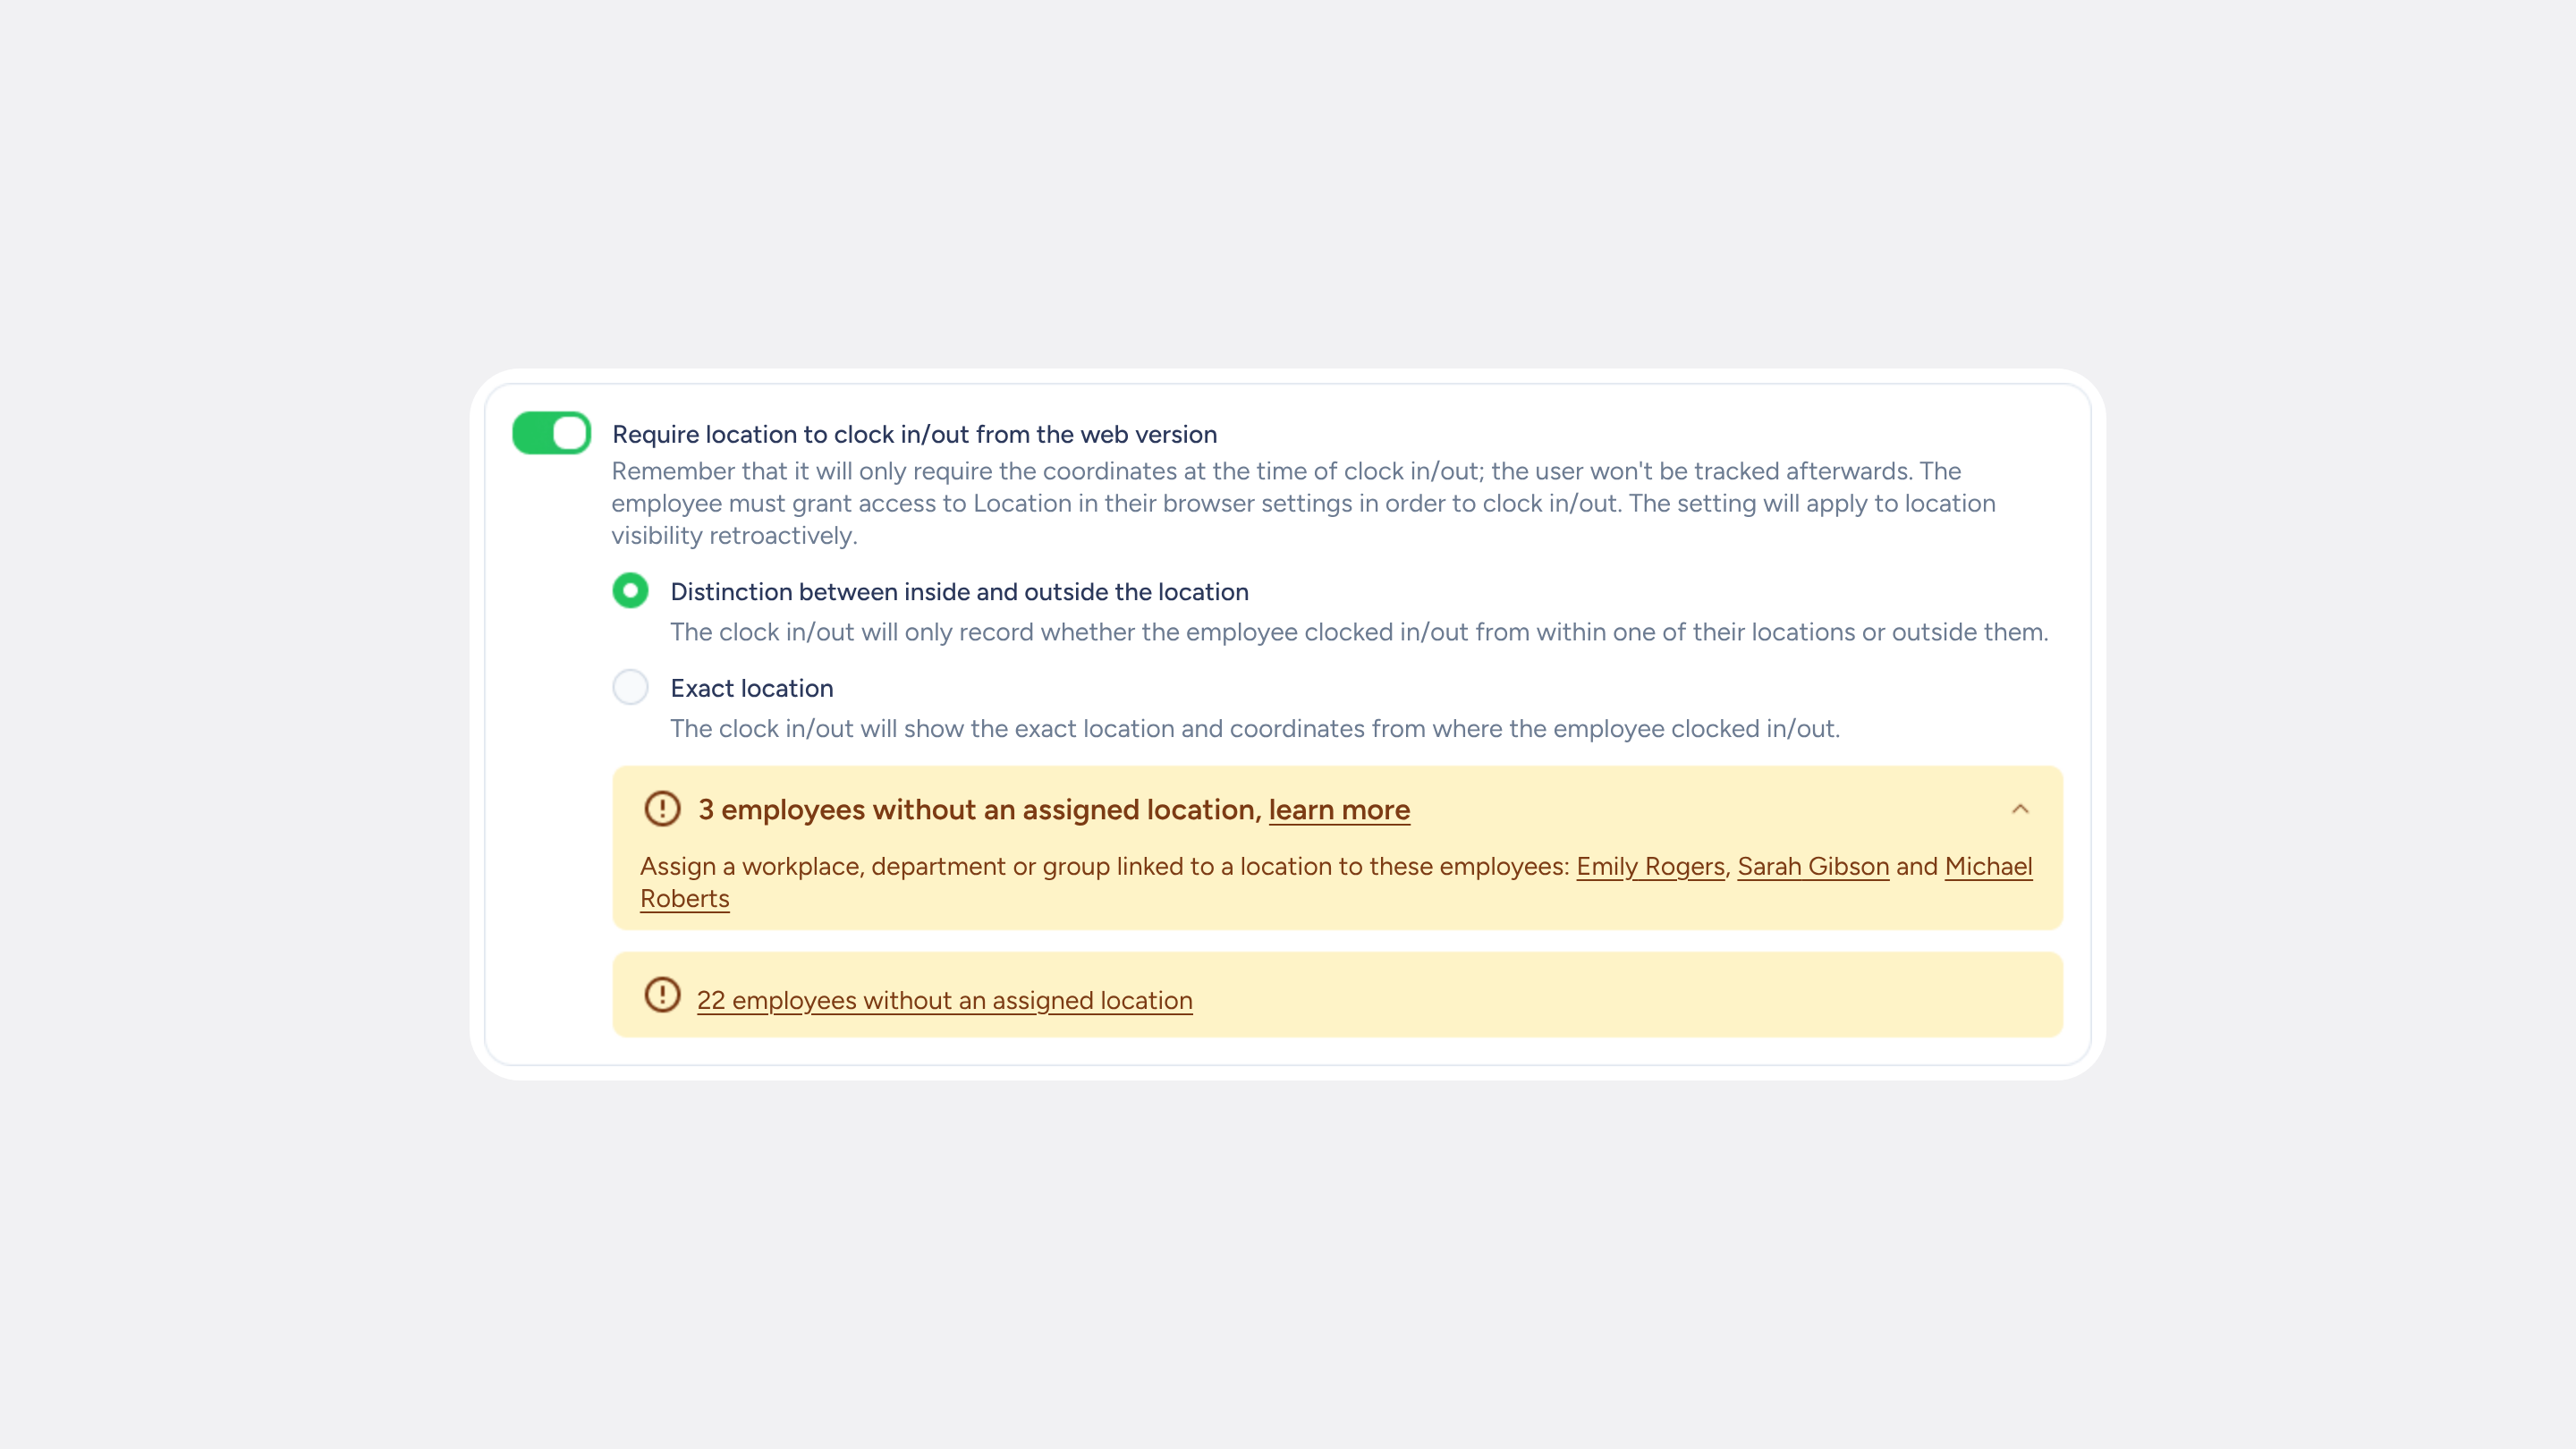
🔔 Spot variances early: a new alert will notify you if there are clock ins/outs recorded without a planned shift, so you can act before closing the period.
Your shift planning, with financial intelligence
The performance indicators give you a 360° view of the financial impact of your shifts: from estimated business volume to actual cost per employee and hours effectively worked. All in one place, ready to export.
You’ll find more information about the performance indicators in the Help Center.