The wait is over! 🎉 Today we’re unlocking the Company results section, a new full-screen view designed to give you a strategic overview of your organization in seconds.
Here’s everything you’ll find inside
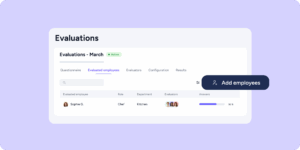
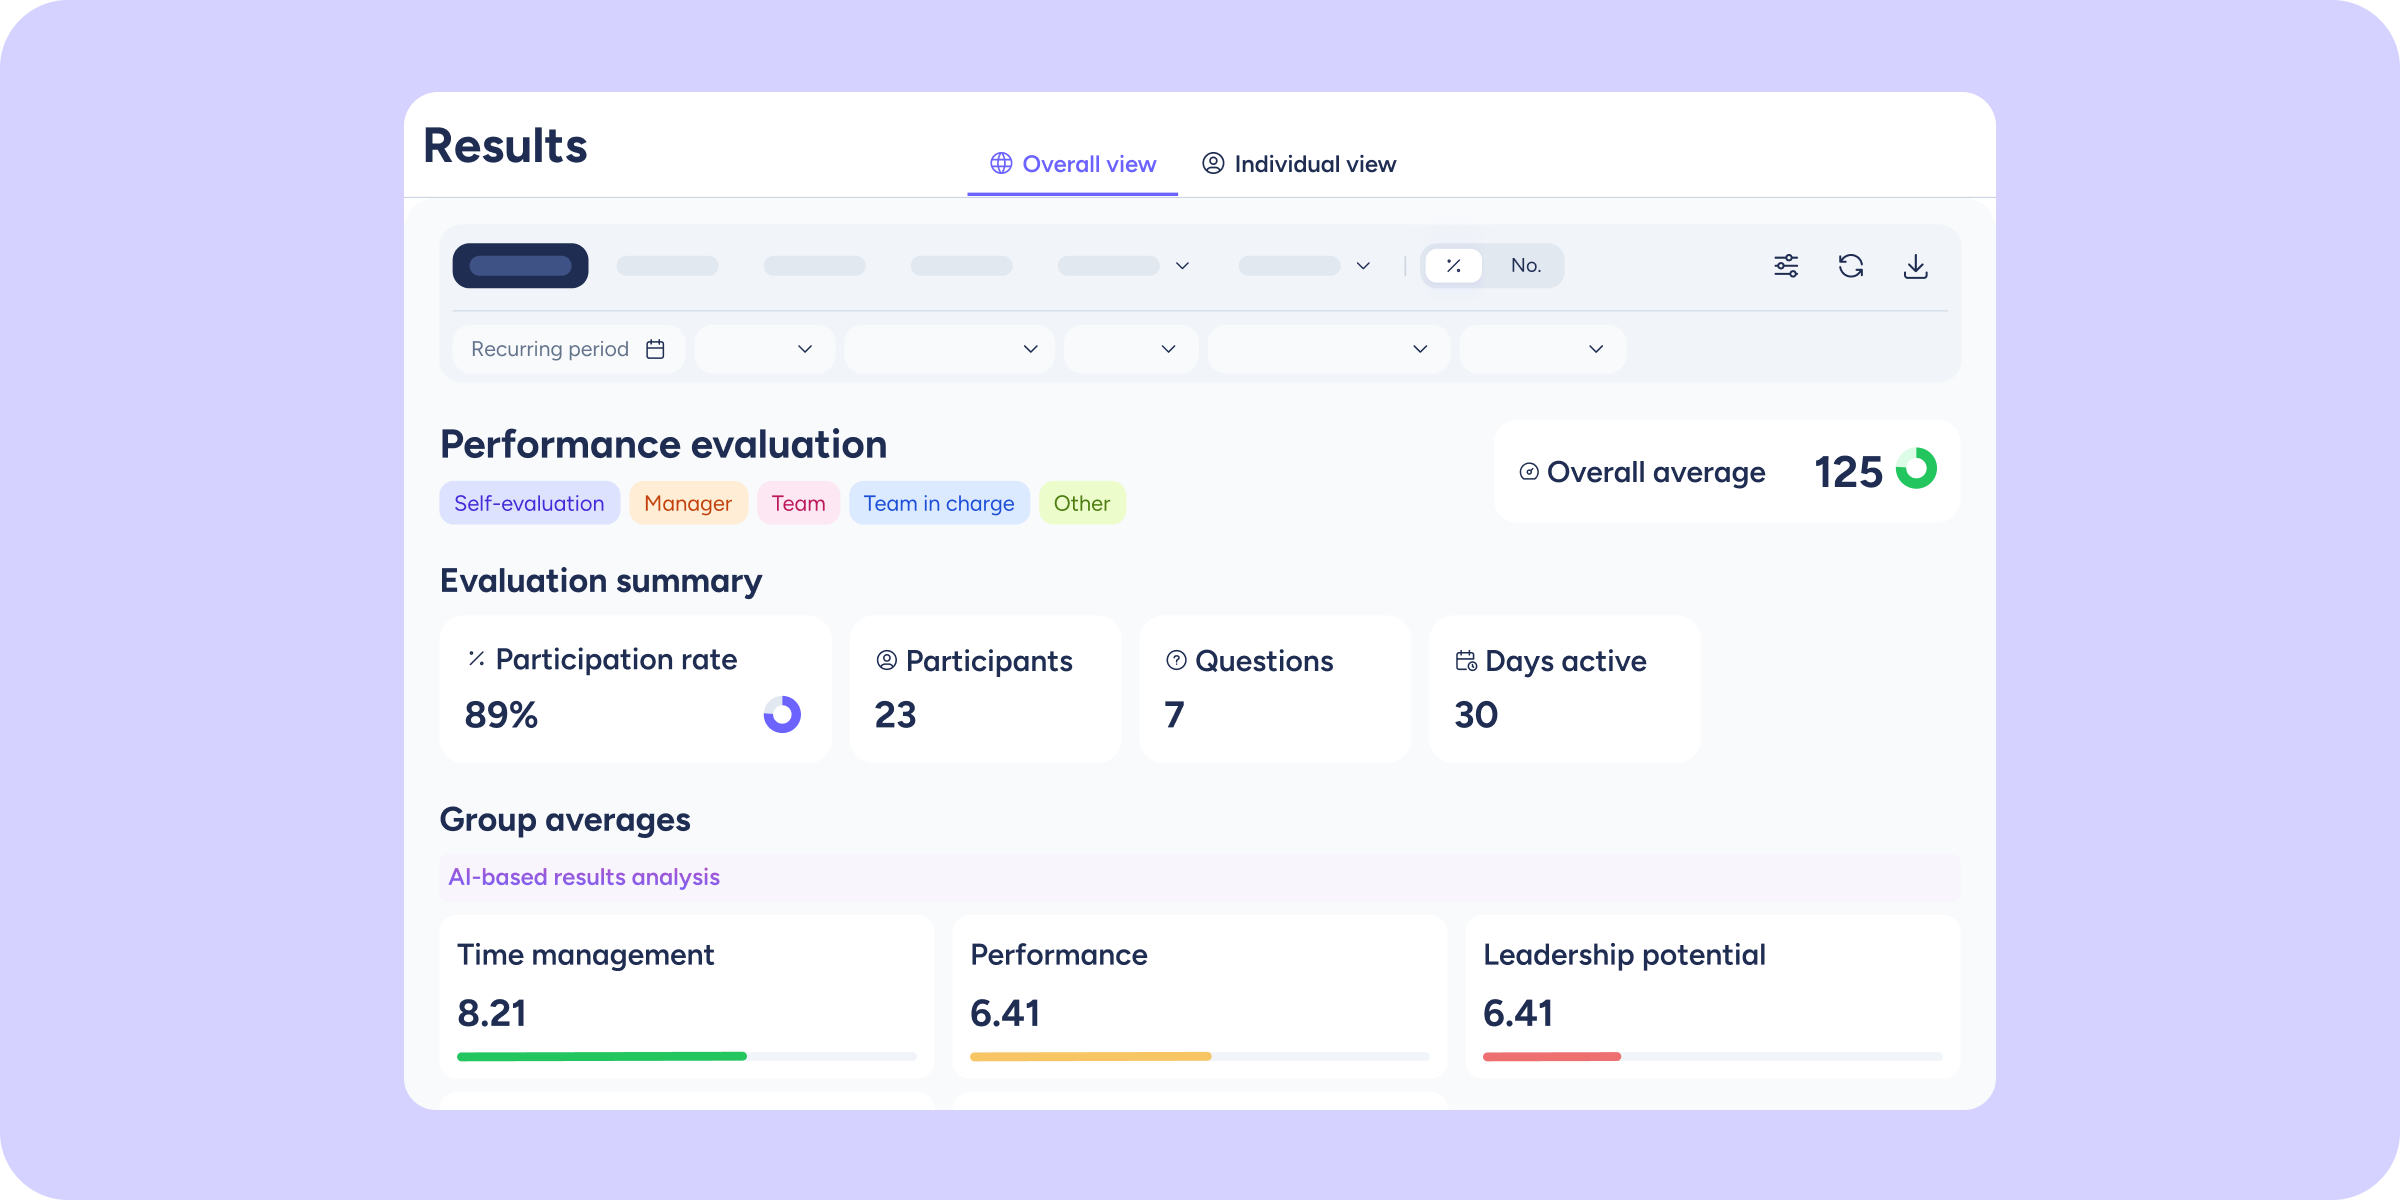
- Evaluation summary
Track key KPIs in real time: participation rate, participants, question groups, questions, and active days. Missing responses? Easily spot pending questionnaires and send a bulk reminder in just one click. - Group averages
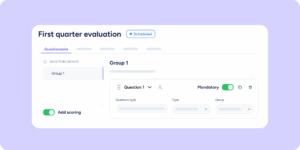
See the average score for each group at a glance. - Groups
Need to dig deeper? Expand each card to view question-by-question details and the exact distribution of responses.
Move smoothly between sections thanks to the fixed top menu. You can also switch how scores are displayed (percentage or numeric) to analyze the data in the way that works best for you.
Other highlights
So you don’t miss a single detail, we’ve added:
- Global filters: cross-reference data by Workplace, Department, Group, or Evaluator type.
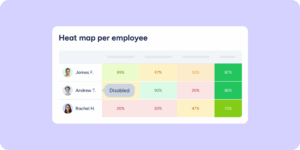
- Color legend: a range guide always visible at the bottom to help you quickly interpret whether a score is high or low.
This is just the beginning. We’re continuing to enhance this section with more data and visualizations. In the meantime, we hope you enjoy this new analytics experience!