We keep raising the bar on analysis in the Company results section. With previous improvements, we were able to map overall performance and compare it across areas. Today, we take a qualitative leap towards strategic talent management: the 9-box matrix.
Until now, analyzing multiple competencies meant reviewing scores person by person. With this new global perspective, you can cross-reference your team’s performance visually and intuitively to identify patterns and make decisions instantly.
Cross-analysis for decision-making
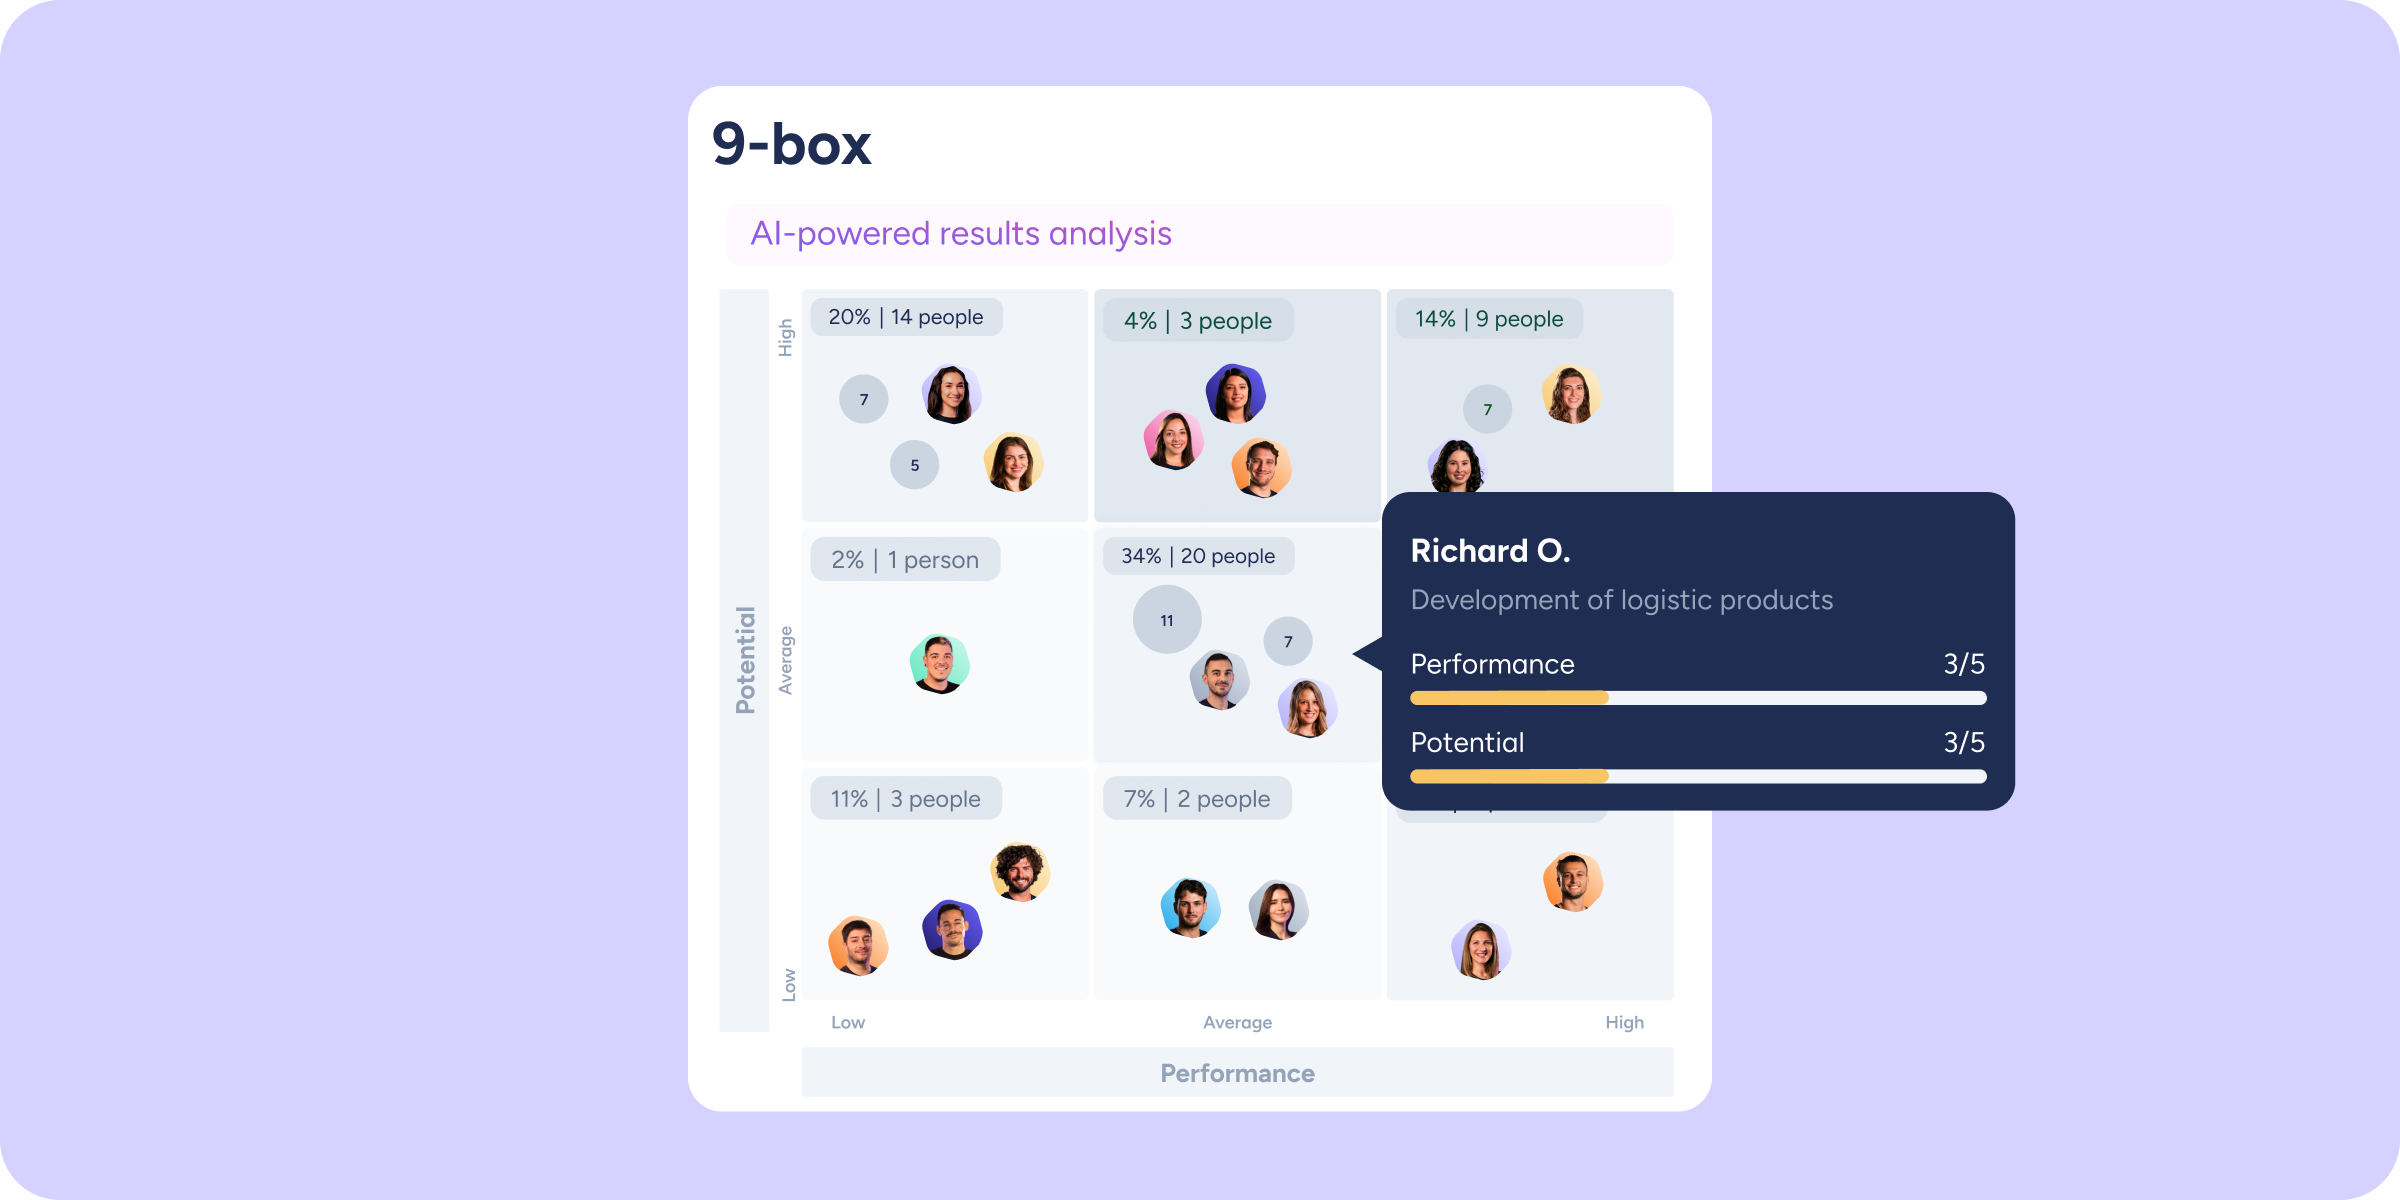
This new matrix transforms data into a dynamic talent map:
- Two-dimensional view: compare two groups or subgroups of evaluation questions simultaneously. Each evaluated employee is placed in the exact quadrant based on their average score on both axes.
- Full customization: if your evaluation includes more than two scored groups, edit the axes to suit your needs and choose exactly which competencies to cross-reference (for example, “Performance” vs. “Potential”).
- Interactive exploration: if several people are close together in the same quadrant, their avatars are grouped in a circle to keep the view clean. Click on it, or on any individual avatar, to expand a list and access the details of their averages on the selected axes.
Precision to pinpoint talent
The 9-box matrix gives you maximum accuracy:
- Filter synchronization: segment the matrix by applying advanced filters by workplace, department, group, or evaluator type. You can cross multiple dimensions, and the view updates in real time.
- Detail focus: use the zoom on any section of the quadrant to get a closer look and see avatars with full names clearly displayed.
- Built-in search: need to find someone’s specific performance? Use the chart’s internal search to quickly locate their exact position within the matrix.
Go to Company results and explore the new matrix in your upcoming Evaluations.